Explaination vs. Prediction

Again, some older post I had lying around. Nonetheless, the topic is still prevalent.

I recently read a great paper named To Explain or To Predict? by Galit Shmueli. She explains the differences between the “old-school” explanatory statistics and predictive statistics. I saw lots of her observations by myself.

That means predictions are often regarded as unscientific and therefore there’s a bit of a lack of good literature – lately the situation became better with the uprising of machine learning.
Nonetheless, most students don’t learn how to make predictions and you see how people use R^2 to validate models.

Sure, there are some departments that teach how to predict but they are still in the minority. Of course, there’s this other trend with Big Data. I’m personally not really excited by Big Data rather by data at all.

More Info: http://galitshmueli.com/explain-predict

I wrote this post more than 2 years ago. Now machine learning became some kind of commodity on a smaller level and something strange happened. Some of the people who work with data but didn’t learn good statistical techniques started to try to explain data which is pretty terrible. It even seems that they try to reinvent statistics. I read a post yesterday called Why big data is in trouble: they forgot about applied statistics which captured this pretty nicely.

The table at the bottom is just unbelievable. It lists different fields and the application of “big data” or “data science”. They also list that in 2012 they finally start to enter fields like biology, economics, engineering, etc. Which is more sad than hilarious. So yeah, I didn’t expect this turn.

Furthermore, I saw more and more “data science” boot camps / programs popping up. Still neglecting statistical foundations. Resulting in even more terrible studies. This trend will probably follow the Gartner Hype Cycle. As far as I can tell the peak is already reached, now it will begin to be disappointing and in a few years actually reach its plateau. Here the latest Hype Cycle from July 2013:

hype-cycle

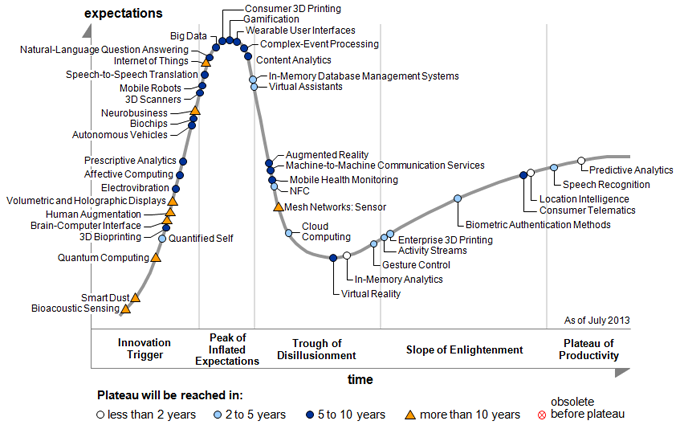
I see the term “prescriptive analytics” on there and just looked it up. It’s astonishing that people reinvent new terms for so much stuff and it still works. Even stuff like business intelligence is basic statistics, then came predictive analysis (still statistics), data science (hey statistics), now prescriptive analytics (still statistics).

I just have to quote one of my favorite quotes on this topic:

Someone (can’t recall the source, sorry) recently defined “data scientist” as “a data analyst who lives in California.” —baconner

#18/25: Statistics for technology

I love reading great books about statistics and Christoper Chatfield is probably one of the greatest educators in statistics. Statistics for technology is a great introduction in statistics which isn’t too theoretical. I won’t provide a summary because these topics are rather rudimentary. However, I found some interesting things in this book, e.g.

A scientific experiment has some or all of the following characteristics.

  1. The physical laws governing the experiment are not entirely understood
  2. The experiment may not have been done before, at least successfully
  3. There are strong incentives to run the smallest number of the cheapest tests as quickly as possible
  4. The experimenter may not be objective, as for example when an investor tests his own invention or when a company tests competitive products
  5. Experimental results are unexpected or disappointing
  6. Although experimental uncertainty may be present, many industrial situations require decisions to be made without additional testing or theoretical study


It is often equally important to know how spread out the data is. For example suppose that a study of people affected by a certain disease revealed that most people affected were under two years old or over seventy years old; then it would be very misleading to summarize the data by saying ‘average age of persons affected is thirty-five years’.

There are some great examples in this book which make statistics for students more interesting in my opinion. The examples are rather technical which is obvious reading the title.

All in all, I can recommend this book if you are want to learn a bit about (technical) statistics. Great book!!

#6/25: Problem Solving: A statistician’s guide

Rules:

  1. Do not attempt to analyse the data until you understand what is being measured and why. Find out whether there is any prior information about likely effects.
  2. Find out how the data were collected.
  3. Look at the structure of the data.
  4. The data then need to be carefully examined in an exploratory way, before attempting a more sophisticated analysis.
  5. Use your common sense at all times.
  6. Report the results in a clear, self-explanatory way.

Thus a statistician needs to understand the general principles involved in tackling statistical problems, and at some stage it is more important to study the strategy of problem solving rather than learn yet more techniques (which can always be looked up in a book).

  • What’s the objective? Which aim? What’s important and why?
  • How was the data selected? How is its quality?
  • How are the results used? Simple vs. complicated models
  • Check existing literature => can make the study redundant or helps to do a better data collection and don’t repeat fundamental errors

collecting

  • Test as much as possible in your collection, i.e. pretesting surveys, account for time effects, order of different studies, etc.
  • Getting the right sample size is often also difficult; sometimes it is too small, other times it is too large; esp. medical research often have rule of thumbs like 20 patients, instead of proper sizes => Tip: look for previous research
  • Try to iterative over and over again to make the study better
  • Learn by experience. Do studies by yourself. It’s often harder than you think, esp. random samples. E.g. selecting random pigs in a horde
  • Ancdote: Pregnant woman had to wait for 3h and therefore had a higher blood pressure -> Medical personnel thought that this blood pressure is constant and admitted her to a hospital.
    • Always check the environment of the study
  • Non-responses can say a lot, don’t ignore them
  • questionnaire design: important! Learn about halo effects, social desirability, moral effects, etc.
  • Always pretest with a pilot study, if possible
  • The human element is often the weakest factor
  • Try to find pitfalls in your study, like Randy James

phases of analysis:

  1. Look at data
  2. Formulate a sensible model
  3. Fit the model
  4. Check the fit
  5. Utilize the model and present conclusions

Whatever the situation, one overall message is that the analyst should not be tempted to rush into using a standard statistical technique without first having a careful look at the data.

model formulation:

  • Ask lots of questions and listen
  • Incorporate background theory
  • Look at the data
  • Experience and inspiration are important
  • trying many models is helpful, but can be dangerous; don’t select the best model based on the highest R^2 or such and offer different models in your paper
  • alternatively: use Bayesian approach for model selection

model validation:

  • Is model specification satisfactory?
  • How about random component?
  • A few influential observations?
  • important feature overlooked?
  • alternative models which are as good as the used model?
  • Then iterate, iterate, iterate

Initial examination of data (IDA)

  • data structure, how many variables? categorical/binary/continuous?
  • Useful to reduce dimensionality?
  • ordinal data -> coded as numerical or with dummies?
  • data cleaning: coding errors, OCR, etc.
  • data quality: collection, errors & outliers => eyeballing is very helpful, 5-point summaries
  • missings: MCAR, impute, EM Algorithm

descriptive statistics

  • for complete data set & interesting sub groups
  • 5-point summary, IQR, tables, graphs
  • Tufte’s lie factor = apparent size of effect shown in the graph / actual size of effect int he data
  • graphs: units, title, legend

data modification

  • test data transformation
  • estimating missings
  • adjust extreme values
  • create new variables
  • try box-cox transformation

analysis

  • significance tests are widely overused, esp. in medicine, biology and psychology.
  • Statistically significant effects not always interesting, esp. using big samples
  • non-significant not always the same as no difference, opposite of previous example
  • enforcement of significant levels, why five not four or one or whatever. This can lead to an publican bias.
  • Estimates are more important, because they communicate relationships
  • Often null hypothesis silly, e.g. water doesn’t affect growth of a plant
    • Better: Interesting resuls should be repeatable in general and under different conditions. (Nelder: significant sameness)

appropriate procedure

  • do more than just one type of analysis, e.g. parametric vs. non-parametric or robust
  • robust good methods better than optimal methods with lots of assumptions
  • don’t just use a method you’re familiar with just because you are familiar with it
  • think in different ways about the problem
  • be prepared to make ad hoc modifications
  • you cannot know everything
  • analysis is more than just fitting the model

philosophical

  • assumed model is often more important than frequentest vs. Bayesian

generally

  • learn your statistics software and a scientific programming language
  • learn using a library, google scholar, searching in general

statistical consulting

  • work with the people; statistics isn’t about numbers, it’s about people
  • understand the problem and the objective
  • ask lots of questions
  • be patient
  • bear in mind resource constraints
  • write in clear language

numeracy

  • be skeptical
  • understand numbers
  • learn estimating
  • check dimensions
  • My book recommendation: Innummeracy
  • check silly statistics: e.g. mean outside of range
  • avoid graph without title and labels
  • don’t use linear regression for non-linear data
  • check assumptions, e.g. mult. regression: more variables than observations
  • my first time working with real data saw how different the process was
  • => Real work isn’t like your statistics 101 course; data is messy, you don’t have an unlimited amount of time or money
  • courses let you think that you got the data, look for your perfect model and you’re done – rather it is 70% searching for data & thinking about pitfalls, 25% cleaning up data and understanding it and about 5% doing the actual analysis

The second half of the book is filled with awesome exercises. I’d recommend everybody working with statistical techniques or working with data checking them out. They are insightful, interesting and stimulating. Furthermore, Chatfield shows that you can reveal insights with simple techniques.
Problem Solving: A statistician’s guide is a clear recommendation for everybody working with data on a daily basis, especially people with less than 2 to 5 years experience. I close with a quote of D. J. Finney: Don’t analyze numbers, analyze data.

25 Books in 2012


So, I decided to do an other book challenge this year. The starting date is maybe a bit late but that’s OK. This year, I want to do a reading challenge again not because I haven’t read any books but rather because I was too lazy to write some review/summary about the books I’ve read.

In comparison to last year’s challenge where I read mostly business books, this year I will read mostly books about economics and statistics. You can see the preliminary reading list in the picture. Some books may change but the volume will probably be the same.

264 days and 25 books left. Let’s start!