Core values of fortune 500 companies

A few blog posts ago I had the idea to compare the values of the fortune 500 companies. You will find the data at the end for free. Here’s how I done it.

Plan

My plan is simple. I need the core values of all Fortune 500 companies, thus I need their websites and a list of all their names. The official site features a list with subpages which feature their websites. Afterwards, I just need to check the pages for core values. Also I document these steps because a few people asked how I got the data from websites.

Let’s start crawling the URLs

I want to write a small crawler to get the URLs for each company. You can find all subpages easily on the initial HTML document, no need to load further sites or such. Let’s download it:

% wget "http://money.cnn.com/magazines/fortune/fortune500/2013/full_list/"

If you look at the code you can find that the subpages look like this:

<a href="/magazines/fortune/fortune500/2013/snapshots/54.html">
<a href="/magazines/fortune/fortune500/2013/snapshots/11719.html">

We can easily extract this URL. Generally, it’s better to use an HTML parser to extract these URL but in this case I just extract the URLs using regex. It’s sufficient for this task. If you work with data that isn’t that nicely structured or has a possibility of using special characters, use an HTML parser.

% egrep -o '<a href="(.*?\/2013/snapshots/[0-9]+\.html)">' index.html
% egrep -o '</a><a href="(.*?\/2013/snapshots/[0-9]+\.html)">' index.html | wc -l
500

The regex is straight forward. If you have questions about it write in the comments. The second line counts the matches which is a good indication that this match was successful. Now I remove the clutter and build the final URL.

% egrep -o '<a href="(.*?\/2013/snapshots/[0-9]+\.html)">' index.html | sed 's/</a><a href="//' | sed 's/">//' | sed 's/^/http:\/\/money.cnn.com/' > urls

The regex is the same. Afterwards I remove the HTML tags with sed and put the domain at first and direct the results into a text file called urls. I’m pretty sure the sed part could be improved but it works and is fast.

Getting the websites

I always start of by looking at the pages I want to crawl to find structure. It looks like that every subpage has a line like this:

Website: <a href="http://www.fedex.com" target="_blank">www.fedex.com</a>
Website: <a href="http://www.fanniemae.com" target="_blank">www.fanniemae.com</a>
Website: <a href="http://www.owenscorning.com" target="_blank">www.owenscorning.com</a>

Let’s download all the subpages and look for ourselves. Remember the urls file? I create a new directory for all the files so it doesn’t clutter my working space up and download them:

% mkdir subpages
% mv urls subpages
% cd subpages
% wget -w 1 -i urls

I limit wget to one download per second (-w 1) so that I don’t get throttled or banned. In the meantime I create the regex to test if this structure from above holds true and I want to get the company name separate:

% egrep -o 'Website: <a href="(.*?)" target="_blank">' *
% egrep -o '(.*?) - Fortune 500' *

Again I counted the results and looked at them and they looked fine. I remove the clutter again and save the data.

% egrep -o 'Website: <a href="(.*?)" target="_blank">' * | sed 's/Website: </a><a href="//' | sed 's/" target="_blank">//' > websites
% egrep -o '(.*?) - Fortune 500' * | sed 's///' | sed 's/ - Fortune 500//' > names

We need to merge these two files. I didn’t remove the file names for each grep, so that I can be sure that they got merged correctly which it did. The final line is:

% paste -d "\t" names websites | sed -E 's/[0-9]+\.html://g' > ../merged

Getting the core values

Now, I could get down and write a crawler who finds the appropriate pages (for example by googling) and extracts the values and all this stuff. But there’s a way which requires less effort. Crowd sourcing. I personally use CrowdFlower which is a great service and because amazon mechanical turk isn’t available in my country. I can use it though by proxy by using CrowdFlower.

Before I upload the file I clean it up. There where some errors in it, e.g. a comma instead of a dot in URL. Then I encased each site by quotes and replaced escaped / replaced characters like quotes. Afterwards I replaced the tabs by commas to make it a csv and added headers.

CrowdFlower offers templates for different jobs. I just created my own. You basically just write an instruction and then create your form. I collected the URL and core values / core beliefs.

The first time I worked with CrowdFlower it may take me 60 minutes to set the task up. Now it takes about 20 minutes. You can’t expect perfect results using crowd sourcing. Some people will limit their effort, other people are extremely diligent. But even if you work with other people you can’t expect perfect results.

Thus the fun part begins where I check the data. I won’t check every detail because this is just for a blog post and not for research purposes. Also, the next time I would change the design of the tasks a bit. But it only costs me about $60 (about 12c per company) and I get the results in less than 4 hours, so I don’t really care.

My initial design was to give the workers the company’s URL and let them find the core values / core believes. The next time I would link to Google with ‘site: “core values”‘ and vice versa with core beliefs. I found this out that some companies have values that only appear in pdfs of their annual report. I didn’t expect the works to look there. Thus, the data will be quite incomplete. Yet, this wasn’t really my initial goal.

What is your goal btw?

Good to talk about that. While I wrote the blog post mention above I thought about how all companies basically have the same values. I expect that some values are very common (>60% of all companies have them). And that there are very few companies, if one at all, who has a unique set of values.

Data cleaning

The fun part. You can download the data directly from CrowdFlower in csv or json. I use the csv file. Trying to import to excel doesn’t really work because excel doesn’t handle the multiline comments correctly. A simple solution is to use R and the xlsx package.

dat write.xlsx(dat, "answers.xls")

The import works pretty fine and even the characters aren’t fucked up. To make the text more readable I change the cells format to wrap text (alignment tab) and clean up the spreadsheet a bit.

I check a few of the entries and correct them, however I don’t try to achieve the highest accuracy but enough for a fun Sunday data project.

Now it’s time to categorize the values. There are various ways: crowd sourcing it, measuring the frequency of words to extract values and then categorize them, using a dictionary with values, etc. I just do it by hand. I took me about 3 hours to categorize all entries. Some responses of the workers were false. I wonder if they had problems understand looking for core values or they just didn’t care. There are quite a lot missing.

Somehow, I took the time to do them by hand. That was quite a lot of work (about 2 hours) but I’m quite happy.

Look at the data

Of the 500 companies I have data for 328 companies (n=328). I grouped them by 60 categories. You can download the data here: data.csv. It is a bit messed up (i.e. I somehow set at least a wrong x because there isn’t a company with diligence as value although there is one).
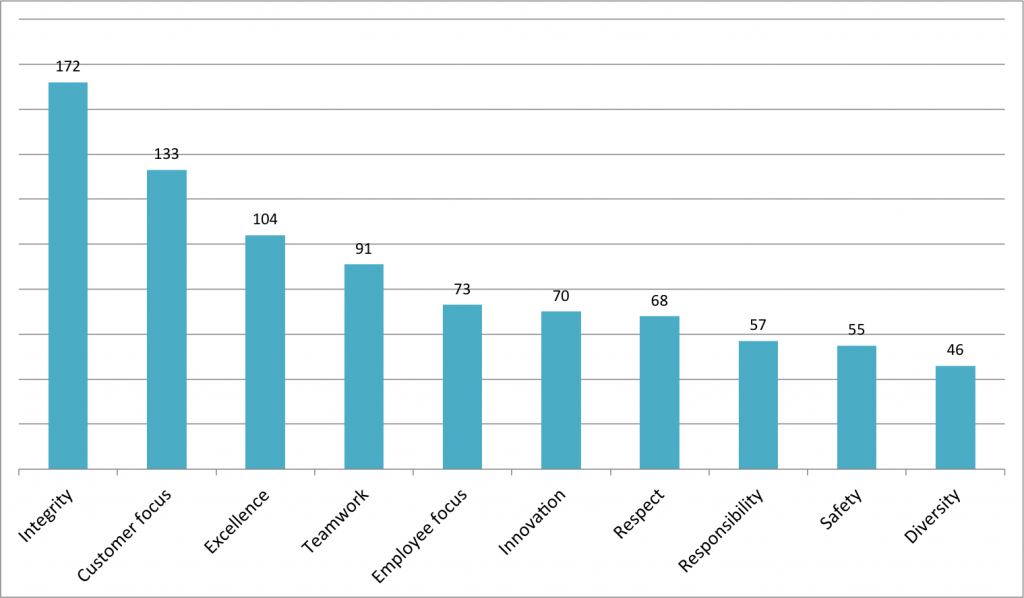
most-popular-valuesThese are the most used values. Over half of the companies state integrity as their value. Customer focus is quite strong and excellence (32%). This is was I expected. Interesting was that only 2 companies stated effectiveness and 8 efficiency. However, a lot of companies talked about hard work. I’m personally more on the side of smart work but I’m not surprised.

Some of the lesser stated values were honor, objectivity and authenticity. Also there wasn’t a company with unique set of values.The data wasn’t that interesting. It could be interesting if you compare stated and lived values. Yet, I’m happy that I’m done. I started today at 9 a.m. and now I’m finished at 11 p.m. I relaxed a few hours but that was basically my project for today. Quite an effort for my initial question.

Fortune: The World’s Billionaires

You may know that Forbes published tons of different and interesting lists, one of them is The World’s Billionaires. I took a look at the data and deepened my R knowledge alongside.

Countries

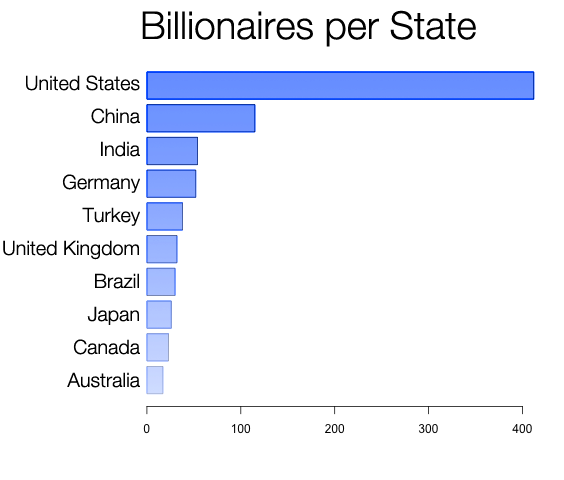
Let’s start with the countries. There are 1007 persons in this data set with valid Country entries.

You can see that most billionaires are born in the US and then with a big gap in China, India, Germany and Turkey. The relative distribution of billionaires worldwide looks a big different:

It mostly took some time to become a billionaire therefore I expect China and probably India to become stronger in the future.

Age

There are a few famous young billionaires like Mark Zuckerberg but most of them are quite older. The first quartile actually starts at 54, the average billionaire is 63 and the oldest one in this data set is 100.

Education

Only 51% of these people got at least a bachelor degree, 20% has a master degree and only 8.7% earned a doctorate or PhD.
Interestingly, about 5% are drop outs and 40 of these 50 drop outs are from the US.

Martial Status

Marriage is still high for billionaires. About 83% are Married, only 7% are divorced. About 5% are widowed and there are 30 singles.

Children

Children are also rather numerous. There are 176 entries with no data, i.e. either missing or no children.
Most billionaires got either two or three children but there are some outlines with 10 children or more. And there is Sulaiman Al Rajhi who got 23 children.

Net Worth

Most billionaires own between between 1 and 3.6 billion USD. The median billionaire owns 2.1 USD. There are, of course, some famous outlines like Bill Gates, Warren Buffett, Larry Ellison and Carlos Slim Helu. The complete net worth of all these billionaires is just 3.7 trillion USD. For comparison, the total US Debt is 14 trillion, that is nearly four times as much.

Self Made?

This was for me, one of the most interesting questions. I asked myself if there are differences between inherited and self-made billionaires between countries.

I’ll pick some examples.
US 69% are self-made
China 96% are self-made
Germany Only 33% are self made

Generally Emerging/New Countries, more self made, what is expected, but US positive example for an older country.

Source

Let’s talk about the sources. Rather interesting is that industries like oil and software which sound really profitable are rather minor industries. I think that has three reasons.

     investments       realestate      diversified           retail          banking 
              84               84               57               53               40 
 pharmaceuticals       hedgefunds            media           hotels     construction 
              29               28               20               19               18 
          mining              oil          telecom             coal          finance 
              18               18               14               12               12 
leveragedbuyouts    manufacturing         software          oil&gas        insurance 
              12               11               11               10                9 

Firstly, becoming a billionaire takes time. It would be great to look at the first time someone became a billionaire, I think that you would probably see clusters, e.g. manufacturing probably started around 1940 but now there are less manufacturing billionaires.
Secondly, some markets aren’t that big. The global real estate market is probably a lot bigger than the global software market.
Thirdly, the ability to oligopolize markets. Let’s take oil and real estate. Oil is pretty much a commodity and you can distribute it world wide without problems. Real estate is locally limited, you can’t take a building block and just put it somewhere else, this limits the market power of companies in this industry.

You can access the data.csv here.

Passionate Programmer: Programming Language and Wage Premium

In the first chapter of Passionate Programmer Chad Fowler talks about the supply of programmers for new technologies and really old ones and wage premiums.

Data

I’ll consider programming language instead of general technology because its too diverse. My first thought was to look at TOIBE which publish a programming language popularity index every month. However, that doesn’t necessary reflect the market demand. So, I looked for other sources and found this blog post which used the indeed jobtrend tool. This gives us a nice idea of trends.

Jan 05 - Nov 11, Jan 09 - Nov 11

Java: +28%, +5%
C: +23%, +1%
C++: -15%, -18%, 
C#: +120%, +24%
PHP: +325%, +140%
Objective-C: +11,000%, +8400%
Visual Basic: -8%, +24%
Python: +610%, +330%
Javascript: +160%, +95%
Perl: +20%, +10%
Ruby: +2,300%, +1,300%
SQL: +30%, +5%
Pascal: -26%, -3%
Lua: +20,000%, +10,000%
Ada: +22%, +16%
Cobol: -45%, -17%
Fortran: -27%, -51%
Erlang: +4,500%, +2,500%
Prolog: -27%, -49%
Haskell: +300%, +225%
F#: +3,250%, +3,250%
Groovy: +4,200%, +3,250%
Scala: +5,500%, +5,500%
Ada: +25%, +17%
CoffeeScript: +2,750%, +2,750%
Clojure: +12,000%, +12,000%
Lisp: +23%, -5%
Delphi: -5%, +7%
ABAP: +15%, +0%

Graphs / Interpretation

Long term and short term growth

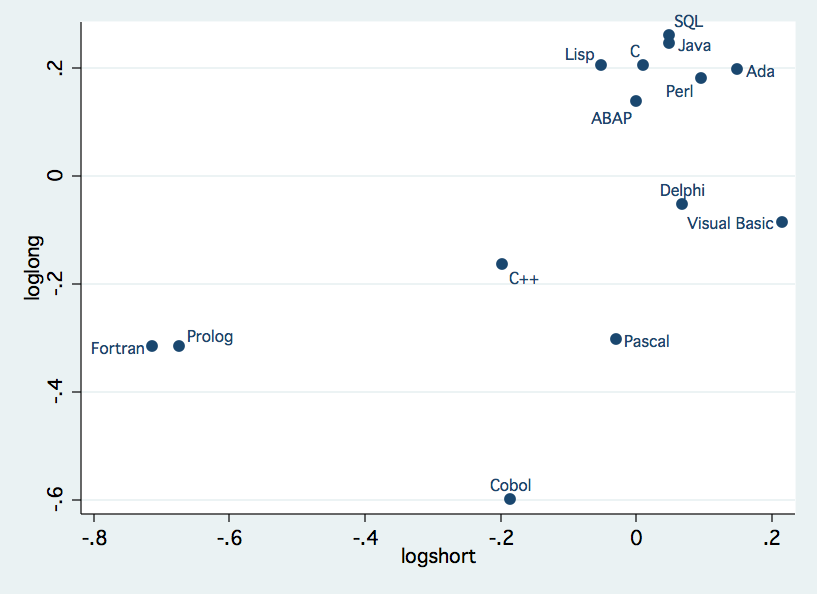
I imported the data into Stata, log transformed ( \log(1+x)) it for readability and plotted it with long (6 years) and short (2 years) term growth. Here you can see the whole graph which is quite unreadable beyond C#.

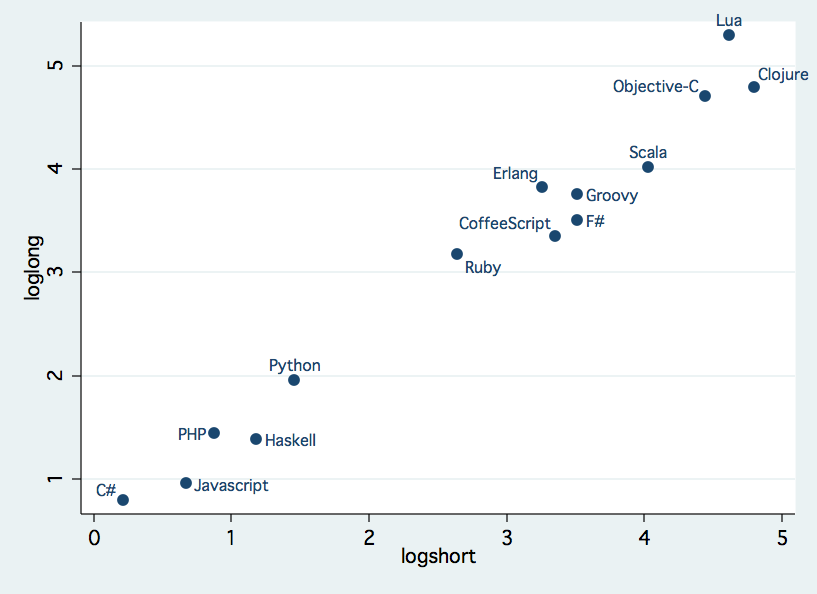
Therefore I split it up into two charts. The first chart contains all languages with less than 100% growth in the last 6 years, i.e. about 12% annual growth on average. This threshold is arbitrary but helps to split the data, so that it is more readable.

For the interpretation: I.e. Cobol is at -0.6 on loglong, i.e. e^{-0.6} -1 \approx -0.45 long term growth. And zero percentage growth means a log value of 0.
We see the expected candidates here, Fortran and Cobol. Ada is quite high which was surprising, at least for me.
Here’s the other half ot the chart:

Some great newcomers are Clojure, CoffeeScript and Scala. PHP is still strong which surprised me, too.
However, it’s important to consider that e.g. that the demand of Clojure developers increased dramatically but it’s still a niche language.

Salary and growth

At the next step, I took the average salary from indeed for each language and normalized it (\frac{\text{salary} - \text{Average salary}}{\text{Std. Dev. salary}}). If we plot this normalized average salary and the log transformed short term growth we get this graph:

Interpretation: avgsalary indicated the percentage of higher/lower salary to the average (~$88,367) in std. dev (about $12,308). For example ABAP got a avgsalary of about 2, therefore the actual salary is 88,367 + 2 * 12,308 = 111,983.

Also I added a linear regression line which slope is actually significant. (\beta_1 = 0.26 and std. err. of \sigma_1 = 0.095
The data is quite fuzzy so don’t get overly excited. For example the data for ABAP is quite skewed because this also includes e.g. consultants. However, we can see a general trend for higher wages for trendier languages which is to be expected.
If we exclude our outliners, i.e. ABAP, Ada and Visual Basic, we get other data.
Average salary increases to $89,720 and its std. dev. decreases to $8,369 (about a third!). Our estimate gets a lot better (\beta_1 = 0.34 and std dev. \sigma_1 = 0.085). And our graph looks a bit different:

We can see even see some kind of clustering. One with languages with logshort > 3 and then there’s this Java, C++, C# cluster. Quite interesting!

SOPA: Donations and Preferences

Data

I saw on Hacker News a neat website posted called (http://www.sopaopera.org/). The comments stated some hypothesis, e.g. that donations of entertainment and internet companies predict the support or opposition of the SOPA bill.
The data is directly from sopaopera.org which itself aggregates it from various sites.

Graphs & Tests

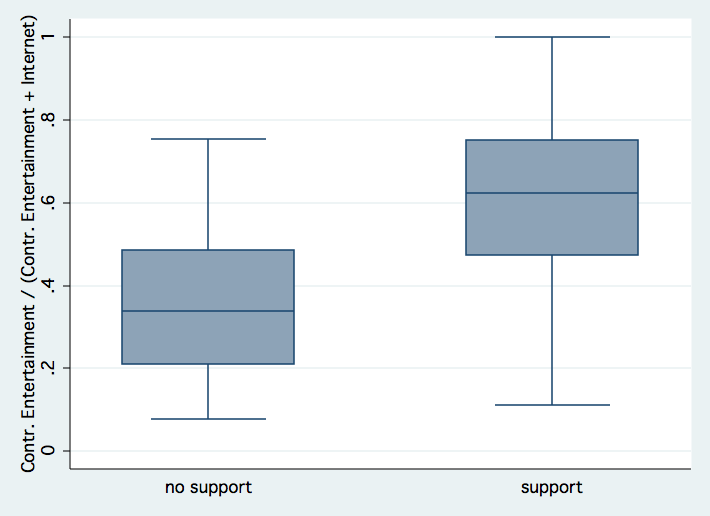
After cleaning the data and importing it into Stata. I looked through it and plotted this box plot which shows how much contributions each group got by entertainment companies in comparison to entertainment and internet company contributions.

In case you don’t know how to read such plot. The thin bars indicate min and max values and the blue box indicates how many people are between the first and third quantile, i.e. 25% to 75% of the population. The line in the blue box shows the median.

You can see that the median for the opposition is about 35% contribution ratio in contrast to the 65% contribution ratio of the supporters. Afterwards, I wanted to test if this difference is significant. In fact, it is highly significant (95%, t = -4.73).

Furthermore, here’s a plot of absolute contributions log-transformed:

The next step is to do a logistic regression to check the prediction quality of each attribute. I regressed with age, party (is_democrat), seniority and quota of entertainment contributions (quota_ent). You can see the results:

 ------------------------------------------------------------------------------
       support |      Coef.   Std. Err.      z    P>|z|     [95% Conf. Interval]  
  -------------+----------------------------------------------------------------
           age |   .0258551   .0358136     0.72   0.470    -.0443382    .0960485
   is_democrat |  -1.252883   .6243361    -2.01   0.045    -2.476559   -.0292067
     seniority |  -.0262688   .0381962    -0.69   0.492     -.101132    .0485943
     quota_ent |   5.839435   1.447732     4.03   0.000     3.001933    8.676938
         _cons |  -1.968467    2.01512    -0.98   0.329    -5.918029    1.981096
  ------------------------------------------------------------------------------

We can see that is_democrat and quota_ent are significant not zero whereby quota_ent is the most significant. This isn’t so much of a surprise.