SOPA: Donations and Preferences

Data

I saw on Hacker News a neat website posted called (http://www.sopaopera.org/). The comments stated some hypothesis, e.g. that donations of entertainment and internet companies predict the support or opposition of the SOPA bill.
The data is directly from sopaopera.org which itself aggregates it from various sites.

Graphs & Tests

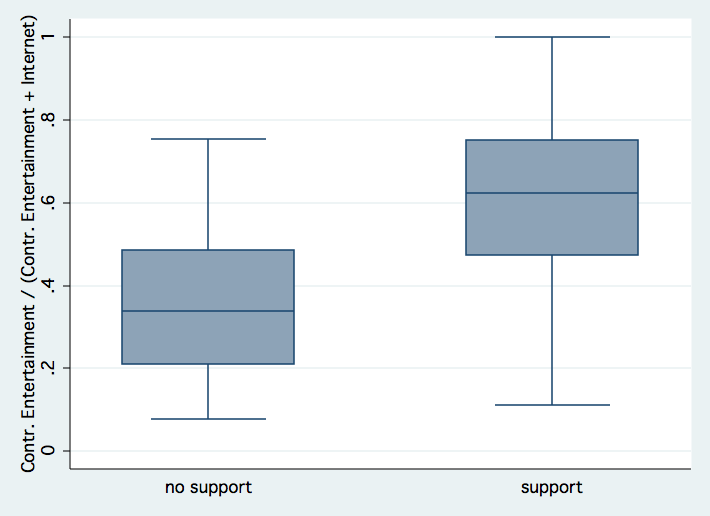
After cleaning the data and importing it into Stata. I looked through it and plotted this box plot which shows how much contributions each group got by entertainment companies in comparison to entertainment and internet company contributions.

In case you don’t know how to read such plot. The thin bars indicate min and max values and the blue box indicates how many people are between the first and third quantile, i.e. 25% to 75% of the population. The line in the blue box shows the median.

You can see that the median for the opposition is about 35% contribution ratio in contrast to the 65% contribution ratio of the supporters. Afterwards, I wanted to test if this difference is significant. In fact, it is highly significant (95%, t = -4.73).

Furthermore, here’s a plot of absolute contributions log-transformed:

The next step is to do a logistic regression to check the prediction quality of each attribute. I regressed with age, party (is_democrat), seniority and quota of entertainment contributions (quota_ent). You can see the results:

 ------------------------------------------------------------------------------
       support |      Coef.   Std. Err.      z    P>|z|     [95% Conf. Interval]  
  -------------+----------------------------------------------------------------
           age |   .0258551   .0358136     0.72   0.470    -.0443382    .0960485
   is_democrat |  -1.252883   .6243361    -2.01   0.045    -2.476559   -.0292067
     seniority |  -.0262688   .0381962    -0.69   0.492     -.101132    .0485943
     quota_ent |   5.839435   1.447732     4.03   0.000     3.001933    8.676938
         _cons |  -1.968467    2.01512    -0.98   0.329    -5.918029    1.981096
  ------------------------------------------------------------------------------

We can see that is_democrat and quota_ent are significant not zero whereby quota_ent is the most significant. This isn’t so much of a surprise.

Addition: programmer personality [statistic]

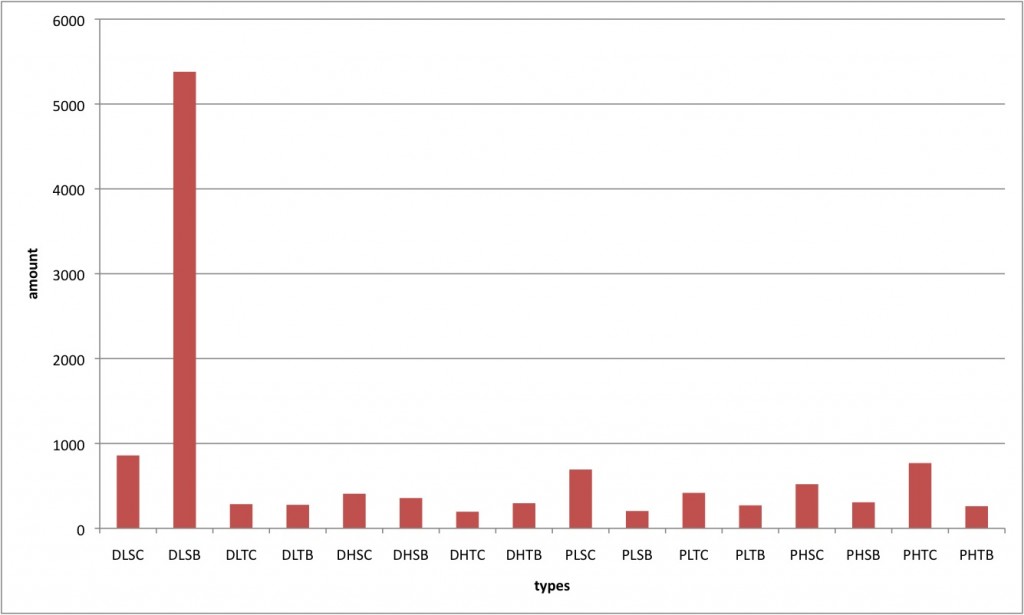
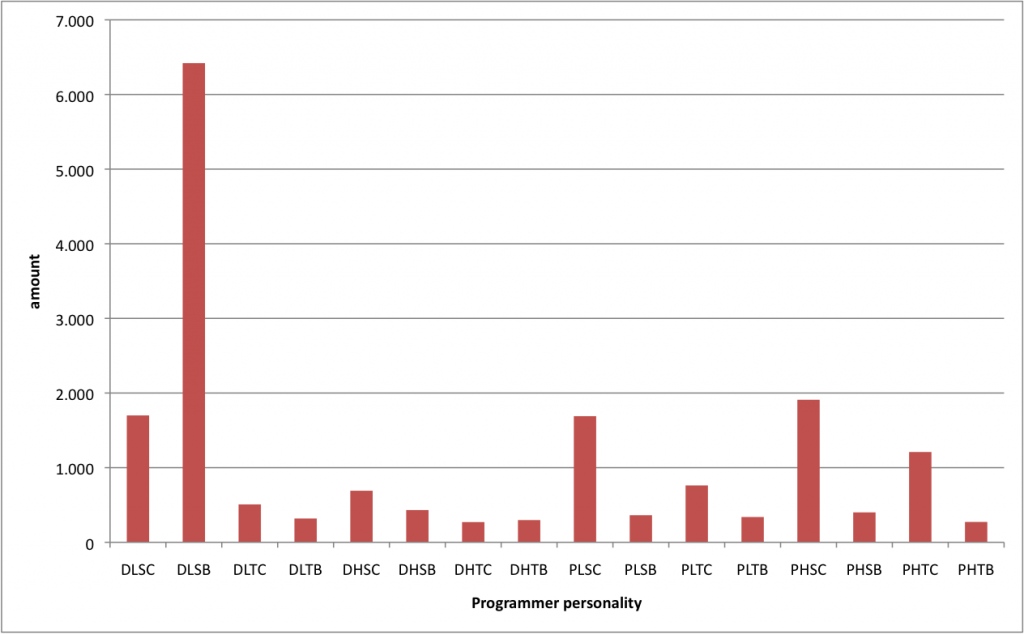
I’ve repeated my information search for better accuracy. Moreover, I’ve added an column char with the single personality factors.
Maybe I’m going to crawl Google’s results for improving accuracy.

Source: Google. searched term: “DHLC” +programmer

programmer personality

Your programmer personality type is:
PHTC

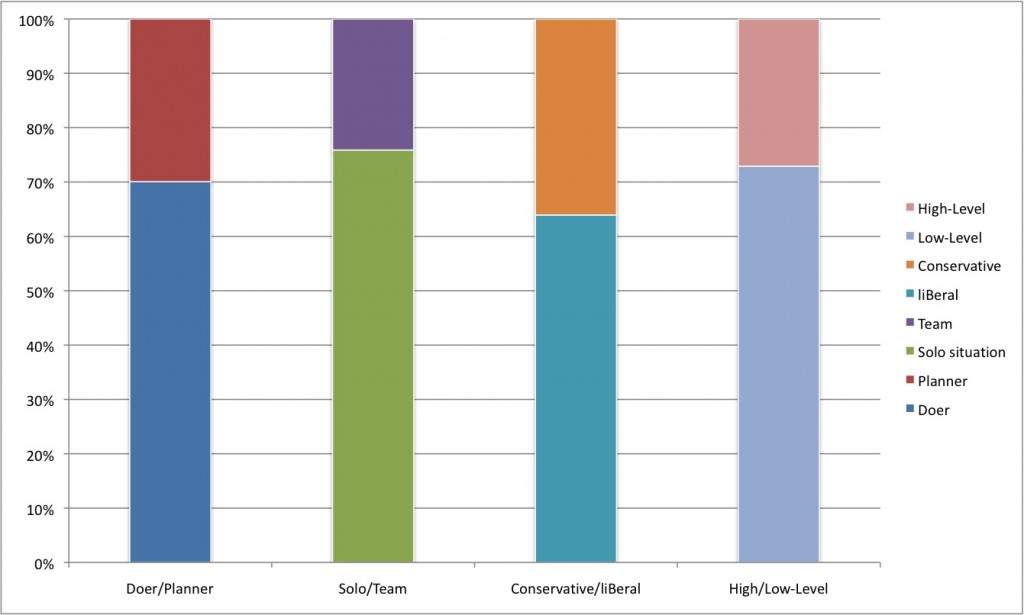
I found this test quite interesting and it’s possible effect on hiring/formation of teams. What would be if people would use this or a more detailed version in the hiring process? Let’s analyze the four different categories:

Doer and Planner
It’s a bit like traditional hacker and software architect. I think it’s more a synergy than a contest. Software architects (planners) plan modules and there are doers who implement them.

High level and Low Level
Low level programmers are rather encountered in embedded system programming, operating system programming and the like. In contrast, high level programmers work on web applications, desktops applications etc.

Solo situation and Team
That’s interesting. Most projects are projects with more than one person. There are definitely exceptions (David Heinemeier Hansson) but generally it’s teamwork.

Conservative Programmer and liBeral programmer
It’s a bit complicated. Doolwind distinguishes between over-commenting and under-commenting. There was a large debate about this (Coding Without Comments). I’m inclined to less but useful comments.

So, would it affect the hiring process? Maybe, the last two points could be crucial. The other points are very job title related, therefore the result is much likely fixed.

Statistic:

Source: Google. searched term: “DLSC” programmer

Take the test: What programmer personality type are you?

The Numerati – Maths is everywhere

You buy things on amazon, search for latest news on Google and write a new blog post on blogspot. These companies are highly delighted when you do this. Not only because you bought a product or clicked on an ad but also they can gather information about you.

Today information is a very important product. Many companies exist only because of this information flood. But why? Why was information not so important hundred years ago?
Stephan Baker gets to the bottom of this change. He investigates several different areas of your daily life and the importance of the Numerati. In The Numerati he shows what people are doing with this data. How they construct mathematical models of customers and electors and why you’re maybe a Right Click if you own a fast broadband connection.

It’s not a textbook but nevertheless very interesting. Anyone who wants to know what you can do with people’s data should read this book. It’s short and stimulative.