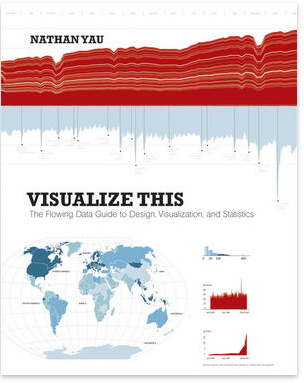
This book was sitting on my shelves for nearly two months and I finally read it. It’s written by Nathan Yau, the guy behind FlowingData.
Visualize this starts of with a intro into one of my favorites topics, i.e. data collecting and cleaning. Yau uses Python, which is a great choice for such tasks. Chapter after chapter he introduces new tools (e.g., Illustrator, R, Google Maps) and shows how to get started with them. I think that pretty much resembles the book. It’s about how to get started in data visualization and its tools.
One critique is that the target group isn’t clear, is it for programmers or graphic designers or statisticians? It’s got a bit for everybody but no thorough path through the book. The examples are quite good and I love it that he shows different steps of creating graphics. The paper and print quality is really good, which is really important for books about graphics and visualization.
All in all, I’m quite happy with this book. It shows how to start and is written by someone who is more connected to the open source/internet world than to academia or corporate one which it quite cool because you don’t have to invest in expensive software to try the examples out.
