Reading Kaushik (Part 1): Digital Marketing

I read Occam’s Razor for quite a while now and I really like Avinash’s style and insights. I thought it would be nice to reread most of his stuff and as a nice extra, I will post my notes on here.

I oriented each section by the section defined in his overview of all articles.

Enjoy!

The 10 / 90 Rule for Magnificent Web Analytics Success

  • There is lots of data but no insights
  • Rule: 10% in tools and 90% people/analysts
    • may seem over the top but
    • med-large websites are complex
    • reports aren’t meaningful by default
    • tools have to be understood
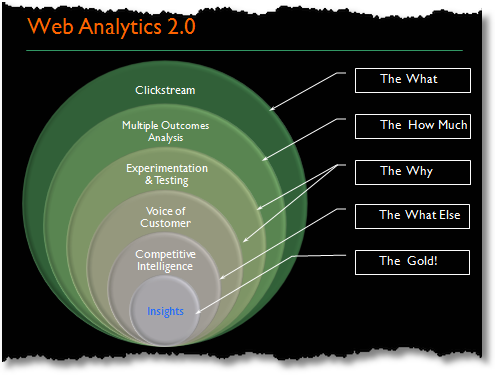
    • there is more than clickstream to analytics
  • If you don’t follow the 10 / 90 Rule
    • Get GA account
    • Track parallel to expensive solution
    • Find a metrics multiplier, so you can compare GA to old data
    • Cancel your contract and hire an smart analyst which will probably deliver more insights for less money

Trinity: A Mindset & Strategic Approach

  • The goal is to generate actionable insights
  • Components:
    • Behavior analysis: clickstream data analysis
    • Outcomes analysis: Revenue, conversion rates, Why does your website exist?
    • Experience: Customer satisfaction, testing, usability, voice of customer
  • Helps you understand what customer experience on your site, so that you can help influence their behavior

The Promise & Challenge of Behavior Targeting (& Two Prerequisites)

  • We have so much behavior data but you get the same content regardless whether you are here to buy or get support
  • There are BT systems but you have still think about the input
  • You have to first understand your customers good enough to create suitable content
  • Test content ideas first to learn what works and as evidence for HiPPOs

Six Rules For Creating A Data Driven Boss!

  • Paradox: The bigger the organization the less likely it is data driven in spite of spending lots of money on tools
  • It is possible to achieve this but you have to actually want to do and fight for it
  • 1. Get over yourself: Learn how to communicate with your boss and try to solve his problems
  • 2. Embrace incompleteness: Data is messy, web data is really messy but still better than completely faith based initiatives.
  • 3. Give 10% extra: Don’t just report data, look at it. Give him insights he didn’t asked for. Make recommendations and explain what’s broken.
  • 4. Become a marketer: Great analysts are customer people. Marketer as internal customer (like account plannner)
  • 5. Don’t business in the service of data: Data should provide insights not just more data. Ask: how many decision have been made based on data that have added value to the revenue?
  • 6. Adapt a Web Analytics 2.0 mindset:

Lack Management Support or Buy-in? Embarrass Them!

  • HiPPOs may be don’t listen to you but they better listen to customers & competitors
  • 1. Start testing
  • 2. Capture Voice of Customer: Surveys, Usability tests, etc.: Let the customer do the talk
  • 3. Benchmark against the competition, e.g. use Fireflick
  • 4. Use Competitive Intelligence
  • 5. Start with a small website
  • 6. Ask outsiders for help

How To Excite People About Web Analytics: Five Tips.

  • 1. Give them answers
  • 2. Talk in outcomes / measure impact
  • 3. Find people with low hanging fruit and make them a hero
  • 4. Use customers & competitors
  • 5. Make Web Analytics fun: Hold contests, hold internal conferences, hold office hours

Redefining Innovation: Incremental, w/ Side Effects & Transformational

  • 1. Incremental innovation, e.g. Kaizen
  • 2. Incremental innovation with side effect, e.g. iPod or Adsense
  • 3. Transformational innovation, e.g. invention of the wheel
  • Web analytics can’t probably create 3
  • Clickstream alone is also not enough for 1.
  • generally the more the better (Web analytics 2.0)

Six Tips For Improving High Bounce Rate / Low Conversion Web Pages

  • Purpose gap between customer intent and page
  • 1. Learn about traffic sources / keywords(!)
  • 2. Do you push your customers against their intent? Identify jobs of each page and focus on your call to actions.
  • 3. Ask your customer what they are looking for
  • 4. Get insights from site overlays
  • 5. Testing!
  • 6. Get first impressions from people, e.g. fivesecondtest

Online Marketing Still A Faith Based Initiative. Why? What’s The Fix?

  • Faith based initiatives like TV, magazines, etc.
  • Online marketing gives us useable data
  • and allows us to test easily
  • The web is quite old yet it is not in the blood of executives
  • Old mental: shout marketing, instead of new inbound marketing
  • Lousy standards for accountability
  • Let the customers speak
  • Benchmark against competition

Win With Web Metrics: Ensure A Clear Line Of Sight To Net Income!

  • Focus on the bottom line, i.e. profits
  • 1. Identify your Macro Conversion
  • 2. Report revenue
  • 3. Identify your Micro Conversions
  • 4. Compute the economic value
  • Net income = Unit Margins * Unit Volumes
    • Unit Margins = Price – Cost
    • Unit Volumes = Market Share * Market Size
  • Because Net Income is the goal, you have to measure Price, Cost, Market Share or Market Size
  • Which metrics help doing that? And if not, why do you track/report this metric?
  • They also depend on the strategies or more general goals of the organization
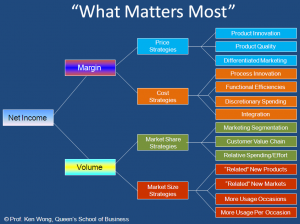
  • — let your “boss” decide what matters most to him/organization
  • identify clear metrics / KPIs for each used strategy
  • use the web analytics measurement framework as a reporting foundation (more to this later)
  • find actionable insights with segmented analysis

Digital Marketing and Measurement Model

  • Marketing with measuring helps you to identify success and failure
  • Digital Marketing & Measurment Model
    1. Set business objectives (should be DUMB)
      • Doable
      • Understandable
      • Manageable
      • Beneficial
    2. Identify goals for each objective
    3. Get KPIs for each goal
    4. Set targets for each KPI
    5. Identify segments of people / outcomes / behavior to understand why things succeeded or failed
  • What scope has the model to cover?
    1. Acquisition: How do people come on your site? Why? How should it be?
    2. Behavior: What should people do on your site? What are the actions they should take? How do you influence their behavior?
    3. Outcomes: What are the goals? (see previous summary)

11 Digital Marketing “Crimes Against Humanity”

  1. Not spending 15% of your marketing budget on new stuff
  2. Not having a fast, functional, mobile-friendly website
  3. Use of Flash
  4. Campaigns that lead to nowhere
  5. Not having a vibrant, engaging blog
  6. “Shouting” on Twitter / Facebook
  7. Buying links is your SEO strategy
  8. Not following the 10/90 rule
  9. Not using the Web Analytics Measurement Model (previous summary)
  10. Using lame metrics: Impressions, Page Views, etc.
  11. Not centering your digital existence on Economic Value

Video: Successful Web Analytics Approaches by Avinash Kaushik

Again a great video, this time about Web Analytics by Avinash Kaushik. I just love his no-BS style.

  • Ask the metric: So what? Three times, if it don’t give an action it’s useless
  • Data should drive action
  • Give people the information they need – don’t send them everything => no death by data
  • Home pages of websites, are no longer the home page you want
    • Where do people come from?
    • What are they looking for?
  • Context matters: previous months, years, etc.
  • Relative numbers more important than absolute numbers
  • Compare different metrics, e.g. conversion rate and page views
  • non e-commerce sites:
    • averages hide truth effectively
    • How often do they visit?
    • How recent did they visit?
    • Depths of visit
    • => Understand the value: Loyalty
  • Segment people
  • Survey people: What do they think about the content?
  • Bounce rate: Came and left
    • Segment by source, entry-page, landing pages, etc.

Rules for Revolutionaries

  • 10/90 Rule: $10 Tools, $90 People: Understand Data & Business, Able to analyze => to extract value
  • Reporting is not analysis: Reporting -> provide data; Analysis -> prove insights
  • Data Quality can be low, but is still better than other data
  • Faith-based initiative: e.g. magazine ad without tracking
  • Make decisions, don’t argue about the quality of the data
  • Over time understand why quality is different -> confidence will get better

    Conclusion

  • Decision making is a journey, not a destination
  • => Put some level of process in place, mostly for tasks, e.g. what happens to implement a test, etc.
  • if HiPPo (highest paid person’s opinion) makes the most decisions
  • => make experiments
  • Learn to be wrong, quickly
  • => You probably don’t know what your customers want
  • => Experimentation

#6/25: Problem Solving: A statistician’s guide

Rules:

  1. Do not attempt to analyse the data until you understand what is being measured and why. Find out whether there is any prior information about likely effects.
  2. Find out how the data were collected.
  3. Look at the structure of the data.
  4. The data then need to be carefully examined in an exploratory way, before attempting a more sophisticated analysis.
  5. Use your common sense at all times.
  6. Report the results in a clear, self-explanatory way.

Thus a statistician needs to understand the general principles involved in tackling statistical problems, and at some stage it is more important to study the strategy of problem solving rather than learn yet more techniques (which can always be looked up in a book).

  • What’s the objective? Which aim? What’s important and why?
  • How was the data selected? How is its quality?
  • How are the results used? Simple vs. complicated models
  • Check existing literature => can make the study redundant or helps to do a better data collection and don’t repeat fundamental errors

collecting

  • Test as much as possible in your collection, i.e. pretesting surveys, account for time effects, order of different studies, etc.
  • Getting the right sample size is often also difficult; sometimes it is too small, other times it is too large; esp. medical research often have rule of thumbs like 20 patients, instead of proper sizes => Tip: look for previous research
  • Try to iterative over and over again to make the study better
  • Learn by experience. Do studies by yourself. It’s often harder than you think, esp. random samples. E.g. selecting random pigs in a horde
  • Ancdote: Pregnant woman had to wait for 3h and therefore had a higher blood pressure -> Medical personnel thought that this blood pressure is constant and admitted her to a hospital.
    • Always check the environment of the study
  • Non-responses can say a lot, don’t ignore them
  • questionnaire design: important! Learn about halo effects, social desirability, moral effects, etc.
  • Always pretest with a pilot study, if possible
  • The human element is often the weakest factor
  • Try to find pitfalls in your study, like Randy James

phases of analysis:

  1. Look at data
  2. Formulate a sensible model
  3. Fit the model
  4. Check the fit
  5. Utilize the model and present conclusions

Whatever the situation, one overall message is that the analyst should not be tempted to rush into using a standard statistical technique without first having a careful look at the data.

model formulation:

  • Ask lots of questions and listen
  • Incorporate background theory
  • Look at the data
  • Experience and inspiration are important
  • trying many models is helpful, but can be dangerous; don’t select the best model based on the highest R^2 or such and offer different models in your paper
  • alternatively: use Bayesian approach for model selection

model validation:

  • Is model specification satisfactory?
  • How about random component?
  • A few influential observations?
  • important feature overlooked?
  • alternative models which are as good as the used model?
  • Then iterate, iterate, iterate

Initial examination of data (IDA)

  • data structure, how many variables? categorical/binary/continuous?
  • Useful to reduce dimensionality?
  • ordinal data -> coded as numerical or with dummies?
  • data cleaning: coding errors, OCR, etc.
  • data quality: collection, errors & outliers => eyeballing is very helpful, 5-point summaries
  • missings: MCAR, impute, EM Algorithm

descriptive statistics

  • for complete data set & interesting sub groups
  • 5-point summary, IQR, tables, graphs
  • Tufte’s lie factor = apparent size of effect shown in the graph / actual size of effect int he data
  • graphs: units, title, legend

data modification

  • test data transformation
  • estimating missings
  • adjust extreme values
  • create new variables
  • try box-cox transformation

analysis

  • significance tests are widely overused, esp. in medicine, biology and psychology.
  • Statistically significant effects not always interesting, esp. using big samples
  • non-significant not always the same as no difference, opposite of previous example
  • enforcement of significant levels, why five not four or one or whatever. This can lead to an publican bias.
  • Estimates are more important, because they communicate relationships
  • Often null hypothesis silly, e.g. water doesn’t affect growth of a plant
    • Better: Interesting resuls should be repeatable in general and under different conditions. (Nelder: significant sameness)

appropriate procedure

  • do more than just one type of analysis, e.g. parametric vs. non-parametric or robust
  • robust good methods better than optimal methods with lots of assumptions
  • don’t just use a method you’re familiar with just because you are familiar with it
  • think in different ways about the problem
  • be prepared to make ad hoc modifications
  • you cannot know everything
  • analysis is more than just fitting the model

philosophical

  • assumed model is often more important than frequentest vs. Bayesian

generally

  • learn your statistics software and a scientific programming language
  • learn using a library, google scholar, searching in general

statistical consulting

  • work with the people; statistics isn’t about numbers, it’s about people
  • understand the problem and the objective
  • ask lots of questions
  • be patient
  • bear in mind resource constraints
  • write in clear language

numeracy

  • be skeptical
  • understand numbers
  • learn estimating
  • check dimensions
  • My book recommendation: Innummeracy
  • check silly statistics: e.g. mean outside of range
  • avoid graph without title and labels
  • don’t use linear regression for non-linear data
  • check assumptions, e.g. mult. regression: more variables than observations
  • my first time working with real data saw how different the process was
  • => Real work isn’t like your statistics 101 course; data is messy, you don’t have an unlimited amount of time or money
  • courses let you think that you got the data, look for your perfect model and you’re done – rather it is 70% searching for data & thinking about pitfalls, 25% cleaning up data and understanding it and about 5% doing the actual analysis

The second half of the book is filled with awesome exercises. I’d recommend everybody working with statistical techniques or working with data checking them out. They are insightful, interesting and stimulating. Furthermore, Chatfield shows that you can reveal insights with simple techniques.
Problem Solving: A statistician’s guide is a clear recommendation for everybody working with data on a daily basis, especially people with less than 2 to 5 years experience. I close with a quote of D. J. Finney: Don’t analyze numbers, analyze data.