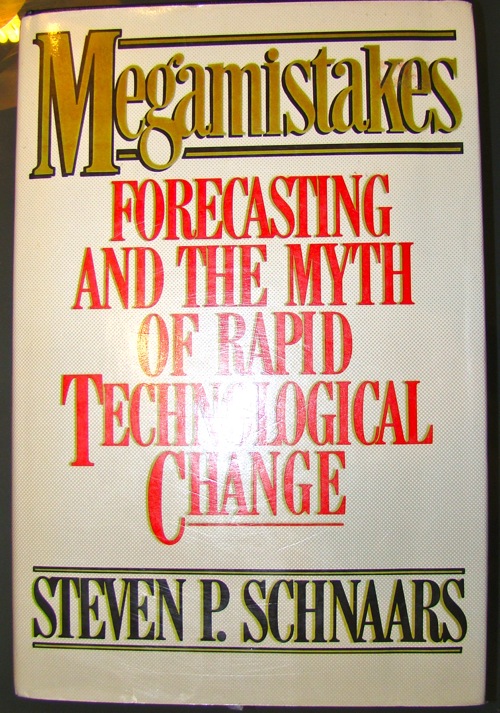
#13/25: The Halo Effect

The Halo Effect talks about business (research) fallacies. The book is extremely insightful and if you like to learn more about fallacies in business, this book is the right for you.

The book starts to talk about management failures and especially practicing core competencies. Often the definition of a core competence is rather fuzzy it isn’t clear where they begin and end. However, in retrospective it can be rather easily defined as “core competence is where success was” – this fallacy can easily lead to decisions which are more motivated by randomness than by action.

A rather interesting observation is that baseball managers, industry analyst, etc. often say that you need to be both: e.g. be innovate and be conservative – saying this is like saying nothing. It doesn’t matter. And it isn’t the only problem. People don’t like randomness – however, a lot of things are influenced by randomness. One prominent example are stock market movements.

Rosenzweig attributes success of companies, like Wal-Mart, in their scientific rigor which doesn’t longer depends on gut feeling and more on data. Wal-Mart was among the first retailers that studyed pattern in consumption and actually applied that knowledge to their operations. The same methodology is used by successful internet companies, like amazon or eBay.

There were some studies in the military where generals rated soldiers subjectively – often they looked if the men where handsome, had a good posture or polished their shoes nicely. However, these weren’t indicators for being a superior soldiers. It was just the Halo effect: thinking that being good in one thing means that you are great in an other (Thorndike). The same fallacy was told in Moneyball.

Once people — whether outside observers or participants — believe the outcome is good, they tend to make positive attributions about the decision process; and when they believe the outcome is poor, they tend to make negative attributes. Why? Because it’s hard to know in objective terms exactly what constitutes good communication or optimal cohesion or appropriate role clarity, so people tend to make attributions based on other data they believe are reliable.

  • Wide variety of behaviors can lead to good decisions => no “optimal” way
  • James Meindl (leadership scholar) found that there’s no satisfactory theory of effective leadership that is independent of performance
  • The Halo Effect is not inevitable => blind interviews, standardized tests
  • Often proxies instead of the real data – be careful
  • Validity only if you don’t try to measure performance directly
    • Don’t ask “Do you have good leadership?”
    • Or “Do you think this is a great place to work?”
  • Also: longitudinal Design – better data, but more time consuming

One recent study, by Benjamin Schneider and colleagues at the University of Maryland, used a longitudinal design to example the question of employee satisfaction and company performance to try to find out which one causes which. […] Financial performance, measured by return on assets and earnings per share, has a more powerful effect on employee satisfaction than the reverse.

  • Problem: single explanation for performance – assumption: no intercorrelation

Anita McGahan at Boston University and Michael Porter at HBS set out to determine how much of a business unit’s profits can be explained by the industry in which it competes, by the corporation it belongs to, and by the way it is managed. This last category, which they called “segment-specific effects,” covers just about everything we’ve talked about in this chapter: a company’s customer orientation, its culture, its human resource systems, social responsibility, and so forth. […] McGahan and Porter found that “segment-specific effects” explained about 32 percent of a business unit’s performance. The rest was due to industry effects or corporate effects or was simply unexplained.

  • Industry and strategy most important
  • Long-term out-performance is very unlikely

Delusion of Connecting the Winning Dots:
Peters and Waterman studied a sample made up entirely of outstanding companies. The scientific term for this is sample selection based on the dependent variable — that is, based on outcomes. It’s a classic error.

Foster and Kaplan wrote: “The last several decades we have celebrated big corporate survivors, praising their ‘excellence’, their longevity, their ability to last.” But companies that last longest usually aren’t the best performers. Enduring greatness is neither very likely, nor, when we find it, does it tend to be associated with high performance.

  • High profits decline thanks to imitation
  • Delusion of Absolute Performance: Company performance is always interdependent on other companies
  • Long-term planning doesn’t work. Flexible views are more successful
  • The Delusion of Organizational Physics: There’s a underlying theme in management
  • Tom Peters, Bobwaterman, Jim Collins and Jerry Porras are great storytellers
  • Assumption: There’s an underlying story / meaning in everything in business => Fallacy
  • “We have just to do X and we will be rich and famous”
  • Add together these three factors – uncertain customer demand, unpredictable competitors, and changing technology – and it becomes clear why strategic choice is inherently risky.

    Successful companies aren’t “just lucky” – high performance is not purely random – but good fortune does play a role, and sometimes a pivotal one.

    • Strategic choices are very important but risky
    • There is luck involved in everything
    • If the data is full of Halos, further analysis is futile
    • Long success is often based on selection after the fact
    • Strategy involves risk – there is no foolproof strategy
    • Chances play often greater roles than we like to think

    I utterly enjoyed The Halo Effect – it is full of business research and shows how it fails or can fail. The three most important lessons are probably:

    1. Avoid the halo effect
    2. Strategy is more important than operational excellence
    3. There is randomness

    It was a bit long but insightful. I would recommend the book to everybody who is interested in business research or is active in management or as a consultant. Recommendation!

#10/25: Mean genes


I picked Mean genes up because a book about behavioral economics recommended it. Let’s see what we can learn from it.

Money / Food

The !Kung San’s behavior provides the clue to resolving the paradox between Americans’ chronic undersaving and the strong evolutionary pressure to prepare for lean times. In a world without refrigerators or banks, preparing for hard times means eating enough food to store some fat on your body.

Many of us would survive, albeit unpleasantly, for more than two months without a single morsel of food.

In this context our genes work quite well. We consume as much as we can and are prepared for hard times. Luckily, however, is that they aren’t so common anymore in the developed world.

Can people really change such firmly entrenched behaviors? Absolutely. The truth is, they’re not even that firmly entrenched.

One method for limiting overspending is to pay in cash rather than with debit. However, the cure to limit overeating is not not eating enough.

The authors describe an experiment in a Biodome where people weren’t allowed to eat enough. This are the results:

On their sparse diets, the Biodomers also argued constantly, go into ugly food spats, and frequently squabbled over dinner portions. After leaving what they dubbed “the hunger dome”, one of the eight said, “If we ever all start talking to each other, that would be a major accomplishment.”

You probably experienced something like that if you are hungry. You are less happy, tense and short-tempered. How about our ancestors?

Of these types, who has the biggest surplus of energy stored in their thighs and buttocks when food is scarce? Who weathers the famine with calories left over for reproducing? Who is most likely to be your ancestor? Fatties, fatties, and fatties again.

What can you do to lose weight?

As expected, some of the new drugs work and others fail, but here’s the strangest finding: people in the placebo groups always lose weight. […] But here’s the trick: while those who take the placebo aren’t using drugs, they are keeping track of their weight and are more aware of what they eat than usual.

Just like in business: You can’t control what you don’t measure. And even just measuring something helps making it more prevalent. You can see the same behavior if people start looking at their energy consumption.

Laziness is good for most animals. To understand this, we have to leave our couches and think like wild primates. Energy in the form of food is hard to obtain, and once gotten, not to be squandered.

Let’s rejoin our mice who hate running. While it’s hard to get them to jog frivolously, they do love a good run under the right conditions. For example, if they are hungry, they spend a good part of the day running. Why? Well, among other things they are looking for food.

Laziness is good because you don’t have to burn energy but using energy is good if this gets you more food.

The subjects were also asked to keep diaries of all their eating on the days around the cookie-fest. Those in the Nutrasweet group [fake sweetener] ate more than those who ate the sugar cookies. So much more, in fact, that the total caloric intake of the two groups was identical. Moreover, those in the Nutrasweet group preferentially ate more sugar.

This is an interesting observation. It seems that, at least for sugar, we eat at much as we need.

Drugs

Isabella’s messed-up enzyme is called aldehyde dehydrogenase, and fully half of Asian people have the same genetic mistake. But hold on. Perhaps we ought to call this mistake a molecular godsend. In a study of thirteen hundred alcoholics in Japan, guess how many were fast-flushers? Not one.

Is addiction in our genes?

While genes have thus been shown to play a role in smoking, drinking, and the use of other drugs, we have clear evidence that genetic factors are not the whole story. Identical twins show similar — but not identical — propensities for drug use. IF a person has a problem with alcohol, and identical twin is 25% – 40% more likely than a fraternal twin to exhibit the same behavior.

Not completely, but the best strategy is not to try drugs. Especially, if you have a family history of addiction, you should avoid them as best as you can.

There’s a drug named Anatabuse which helps fight alcoholism. Does it work?

Anatabuse seems perfectly designed to foil alcoholism. Most studies conclude, however, that it is of minimal help in treating alcoholism. How can that be? Take a look in the user’s bedroom or garbage or toilet. Stories abound of alcoholics who flush their daily pill down the toilet or “”cheek” it, only to deposit it later.

Again. Even with medicine helping fight addiction, the addiction is hard to fight.

Gambling

Imagine two types of humans, those who cowered in their caves and those who explored new areas. While many of the risk-takers died, those who gambled and won populated the entire globe.

Not only were our ancestors risk-takers, it also has an other effect:

Risky behavior stimulates the dopamine reward systems. Some people are born with systems that muffle the buzz they get from taking risks. […]

Our overconfidence even allows people to believe they might win the lottery. By creating such unrealistic beliefs, our genes goad us into taking greater risks than we might otherwise choose.

A common use of this information is the following:

Publisher’s Clearinghouse struggled for many years until it decided that instead of rewarding many entrants with medium-sized prizes, it would offer great prizes with tiny odds. As one executive recounts, “People don’t care about the odds, only the prizes.”

Happiness

When it comes to happiness, the most common story is that happy children grow up to be happy adolescents who then become happy adults. The best way to ensure that we’ll be surrounded by upbeat people in the future is to be friends with happy people now.

As you enter the crowded scene, you must choose one of two lines. The first choice is an hour’s wait in a short line that movies slowly. [..] The second choice is an hour’s wait in a long line that moves quickly. […]
Which line would you prefer? For most people, the second line is much better.

Today, most super markets and other places with waiting lines implement this strategy. People like making progress.

We can start by recognizing the quirky ways our brain creates happiness and then capitalize on that knowledge. There are three important features of our genetic system. First, absolute levels have little effect on happiness. Second, we love making progress. Third, expectations play a central role.

Expectations are indeed important. For example, wine tastes are influenced by expectations. The same works for Cola vs. Pepsi. The best you can do is under-promise and over-deliver. Technically, you should read the lowest ratings of a movie only, then you won’t be disappointed or maybe even astonished how good the movie was.

Mean genes was okay. It’s written as a popular science book and lacks deeper insights. Furthermore, there are no notes in the book, only on their website. It’s a nice read but that’s it.

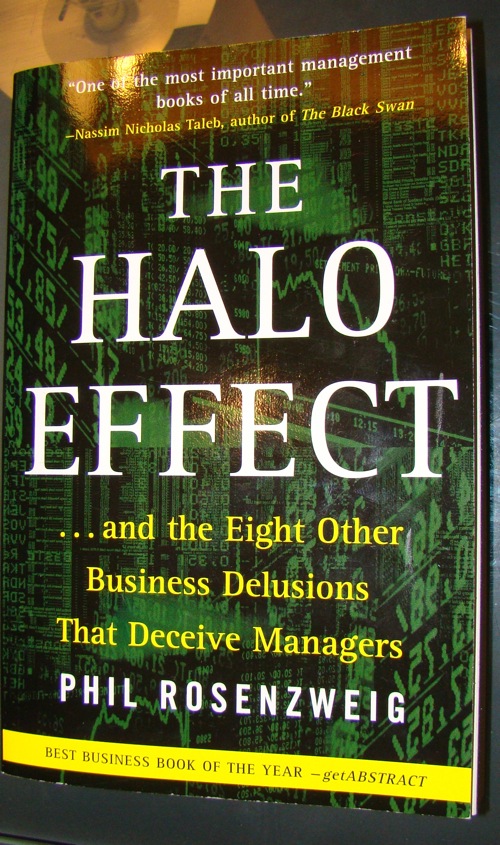
#8/25: Megamistakes

Megamistakes was published in 1989 – so, it’s especially interesting to look at a book about forecasting which is over 20 years old. Most of this article will be quotes of the book. Enjoy!

The most prominent reason why technological forecasts have failed is that the people who made them have been seduced by technological wonder.

The forecasters who construct them are blinded by their emotions and lose perspective of commonsense economic considerations.

A key premise of forecasting is that a passionate focus on technology for its own sake spells disaster. No doubt, many of the same errors are being repeated today.

How much I love these three sentences. Year and year again we see some people praising some new technology to be the “next big thing”, “bigger than the internet” or whatever and a few years later nobody remembers about that technology.

As one expert noted: “We can build all kinds of mass-transit vehicles, but no one has yet found what’s going to make people want to get out of their cars and ride them”

A common technological trap. I thought for the most part of my life that technology can solve practically every problem. But if you look deeper, the problem is often psychological or cultural. Today, we see that lots of young people don’t necessarily need a car – forty years ago this was unthinkable.

Computer forecasts are exceptional in this regard. IT is one of very few industries where optimism was warranted.

This is really exceptional. Even the overoptimistic forecasts became true.

The method did not matter. Asking the right questions did. Nuclear ships had no effect on the industry. Lower-cost international competitors did.

This was a common theme in the last decades. Especially, in the US people thought about technology but neglected international developments.
Look at the flight industry. Flights didn’t really got cheaper because Boeing developed an innovate air plane. It got cheaper because of deregulation and lower barriers to entry.

It is good advice to be skeptical of any forecast that calls for a new age.

The lesson to be learned here is that although we read so much today about how things will change rapidly, the home of the future will probably look pretty much like the home of today

If you exclude computers then not so much has changed in the last 10 – 20 years. We pretty much life in the same houses, shower in the same shower, eat practically the same food (also people buy much more organic today). Cars haven’t really changed – the most change came through computers. Things like notebooks, smart phones, car navigation systems, etc.

In 1987 Tyzoon Tyebjee conducted some experiments on biases in new product forecasting. […] He found that the very act of participating in the new product planning process led to overly optimistic forecasts.

This is an interesting result for especially for technology startups, or more so for investors.

He [Nigel Calder] is particularly impressed with the performance of Barbara Wooten, a social scientist who made prediction in the 1964 study. She made “forecasts that seemed damp and depressing at the time.” In hindsight, however, they turned out to be remarkably accurate. Why? According to Calder, because she presumed “that the pattern of social life would not be remarkably different”

Later there’s more about demographic forecasting and it works pretty well.

There is absolutely no evidence that complicated mathematical models provide more accurate forecasts than much simpler models that incorporate intuitively pleasing rules of thumb. In growth market forecasting it seems less important whether the model is fancy or not than whether the model incorporates the right assumptions.

In the excellent book Forecasting (a newer version is freely available) they basically came to the same result. Often simple methods like exponential smoothing work better than highly complicated models.

In a 1985 article in Management Science, Everette Gardner and Ed McKenzie proposed a simple mathematical model that incorporates a “damped” trend. […] They and others, including myself, have tested their model in many different types of applications. Almost universally, it has been found to be more accurate.

And dampend trends work even better. You can read more about them int he same book as above for free: 7/4 Damped trend methods.

A central thesis of diffusion of innovation is that some initial group of customers purchase new products. They are called the innovators. […] After a while, a second group of customers, opinion leaders, enters the market. Rapid market growth ensues as many other consumers imitate the purchases of these respected members of society. […] Then growth slows, as nearly everyone is using the product.

The problem with using research arising out of the diffusion of innovations, the product life cycle, and market growth curves is that they ignore the fact that market growth is not guaranteed, or even likely.

Like the quote says the big problem is that the diffusion of innovation models only explains successful products, so it’s not of much use pre-success.

The Zeitgeist concept is used to explain the fact that inventions and discoveries tend to be made simultaneously by researchers working independently.

Consequently, the Zeitgeist means that inventions and discoveries are due less to the power of individual genius than to the spirit of the times.

The Zeitgeist also casts doubts on the merits of consensus forecasts. It implies that a consensus forecast is not difficult to obtain, but that the consensus may be more indicative of present beliefs than of actual future outcomes.

We’ve seen a lot of inventions happen simultaneously. Schnaars also notes that not only inventions are covered under the Zeitgeist concept but also forecasts. It’s interesting that each decade had its own Zeigeist and the forecasts mirrored it dramatically. Even Schnaars himself contributes to this by emphasizing the industrial strength of Japan and other non-US countries which was a big topic in the mid-late 80’s.
Here are some excerpts from Megamistakes:

Cars would also move into the jet age. All three American automakers spent heavily on turbine cars using jet technology. The transfer of technology from airplanes to autos failed to generate a growth market. It was an impractical idea.

All in a setting where children wanted to grow up to be astronauts rather than computer wizards. People were fascinated by space travel.

Imagine yourself in the late 1970s forecasting that energy prices would decline throughout the 1980s. For one, it never would have happened. Such a forecast would have been preposterous at the time. All the indicators of the day pointed to ever higher oil prices. Some even talked of the end of the petroleum age. Even if you had made the forecast, who would have believed it? It was inconsistent with the beliefs of the day.

The last two sentences are insightful. It’s hard to argue against the general belief. In science, there’s the observation that beliefs don’t die, but the people having them. It’s probably the same for normal people. In 10 or 20 years we will look back and saw some stupid belief we have today.

What to do?
Start with a simple price-performance analysis:

* What additional benefit does this product offer over existing entries?
* Will consumers have to, and be willing to, pay extra for it?
* Does the product offer a benefit over existing products that justifies a higher price?

This will filter out easily half of the promising technologies. In this book, Schnaars applies these three questions to a lot of different technologies, like moving side walks and video conferencing.

Predicting social trends is one of the most difficult forecasts to make. Social trends involve people, who, unlike physical quantities, do not behave according to physical laws.

In the permissive 1960s, for example, who would have predicated that a conservative President would be overwhelmingly elected in 1980? Radical college students in the 1960s saw a revolution in this country as a real possibility. In the 1980s, those same persons flocked to business schools and coveted highly paid careers in investment banking.

Demographic forecasts that sought to predict birthrates and other events that had not yet occurred often proved mistaken.

There are two different things here. Forecast of social trends and demographic forecasts. Social trends are extremely hard and probably more random than most of the things. Demographic forecasts, however, can be rather accurate if they people are actually born, yet.

For example, in 1960 Business Week analyzed census data and concluded: “During the next twenty years the number of Americans over 75 will increase to 9 million.” This forecast of the elderly segment of the population proved close to perfect. The 1980 Census counted 8.94 million persons over the age of seventy-five.

However, a problem is if you assume demographic and cultural forecasts behave identically.

Forecasts are particularly vulnerable when they assume that a growth market will result when a large group of consumers enters the primary age for heavy demand of a product category. Such forecasts assume that the younger group will follow the pattern set by its parents.

Like Elster said, either the young will do the same as the parents or something different. Don’t assume that younger people will do the same as their parents.

Are forecasts possible?

Yet a Business Week editorial foresaw the oil crisis about two years before the actual event. It stated that “the stage is being set for an energy crisis in the U.S. by the end of this decade. […] In a time of international crisis, oil supplies could be cut off.”

This is one example. There were a people who foresaw the 2008 financial crises and there were a ton of people who questioned the sustainability of Groupon.

Surprisingly, firms holding a commanding share of their market are often among the last to foresee potential threats to their bread-and-butter products. As a result, market leaders often miss the opportunities that they themselves should have created.

Remarkably, time and time again, in industry after industry, market opportunities have been more apparent to outsiders than to those with a dominant position in the industry.

We see this time and time, again. Schnaars describes one of the slide rule manufacturers. A giant – then came the micro chip and they though that this doesn’t really influence their market. A decade later they shrunk into a small business.
A similar thing happened to IBM where they declined the possibility of creating (enterprise) software, etc. etc.

Guidelines:

  • Avoid technological wonders
  • Ask fundamental questions about markets:
    • Who are the customers?
    • How large is the market?
    • Will the new technology offer them a real benefit over existing and subsequent substitutes?
    • Is the technology cost-effective relative to those substitutes?
    • Is the derived benefit worth the price you will have to charge?
    • Are cost efficiencies probable?
    • Are social trends moving toward or away from this market?
    • Does the innovation require users to do things differently?
    • Does the innovation go against customs, culture, or established business practices?
  • Be suspicious of trend projections
  • Avoid extrapolating the issues of the day
  • Challenge Assumptions

There are some alternatives to “traditional” forecasting:

  • Scenario Analysis – I would recommend Solving Though Problems as a nice book on scenario analysis
  • Follow rather than lead – be innovator
  • Perpetual innovation: always innovate -> start small, try, then scale
  • Assume that the future will be similar to the present

Such an awesome book. I really loved reading Megamistakes. It’s full of insights. Schnaars shows different forecasts from different time periods. It’s astonishing how strong the Zeigeist influenced their forecasts. Furthermore, a lot of time he quotes other forecasters and their experiences. And you can get a used copy for under $5. It’s a fantastic book and should be read by nearly everyone! Recommendation!

#6/25: Problem Solving: A statistician’s guide

Rules:

  1. Do not attempt to analyse the data until you understand what is being measured and why. Find out whether there is any prior information about likely effects.
  2. Find out how the data were collected.
  3. Look at the structure of the data.
  4. The data then need to be carefully examined in an exploratory way, before attempting a more sophisticated analysis.
  5. Use your common sense at all times.
  6. Report the results in a clear, self-explanatory way.

Thus a statistician needs to understand the general principles involved in tackling statistical problems, and at some stage it is more important to study the strategy of problem solving rather than learn yet more techniques (which can always be looked up in a book).

  • What’s the objective? Which aim? What’s important and why?
  • How was the data selected? How is its quality?
  • How are the results used? Simple vs. complicated models
  • Check existing literature => can make the study redundant or helps to do a better data collection and don’t repeat fundamental errors

collecting

  • Test as much as possible in your collection, i.e. pretesting surveys, account for time effects, order of different studies, etc.
  • Getting the right sample size is often also difficult; sometimes it is too small, other times it is too large; esp. medical research often have rule of thumbs like 20 patients, instead of proper sizes => Tip: look for previous research
  • Try to iterative over and over again to make the study better
  • Learn by experience. Do studies by yourself. It’s often harder than you think, esp. random samples. E.g. selecting random pigs in a horde
  • Ancdote: Pregnant woman had to wait for 3h and therefore had a higher blood pressure -> Medical personnel thought that this blood pressure is constant and admitted her to a hospital.
    • Always check the environment of the study
  • Non-responses can say a lot, don’t ignore them
  • questionnaire design: important! Learn about halo effects, social desirability, moral effects, etc.
  • Always pretest with a pilot study, if possible
  • The human element is often the weakest factor
  • Try to find pitfalls in your study, like Randy James

phases of analysis:

  1. Look at data
  2. Formulate a sensible model
  3. Fit the model
  4. Check the fit
  5. Utilize the model and present conclusions

Whatever the situation, one overall message is that the analyst should not be tempted to rush into using a standard statistical technique without first having a careful look at the data.

model formulation:

  • Ask lots of questions and listen
  • Incorporate background theory
  • Look at the data
  • Experience and inspiration are important
  • trying many models is helpful, but can be dangerous; don’t select the best model based on the highest R^2 or such and offer different models in your paper
  • alternatively: use Bayesian approach for model selection

model validation:

  • Is model specification satisfactory?
  • How about random component?
  • A few influential observations?
  • important feature overlooked?
  • alternative models which are as good as the used model?
  • Then iterate, iterate, iterate

Initial examination of data (IDA)

  • data structure, how many variables? categorical/binary/continuous?
  • Useful to reduce dimensionality?
  • ordinal data -> coded as numerical or with dummies?
  • data cleaning: coding errors, OCR, etc.
  • data quality: collection, errors & outliers => eyeballing is very helpful, 5-point summaries
  • missings: MCAR, impute, EM Algorithm

descriptive statistics

  • for complete data set & interesting sub groups
  • 5-point summary, IQR, tables, graphs
  • Tufte’s lie factor = apparent size of effect shown in the graph / actual size of effect int he data
  • graphs: units, title, legend

data modification

  • test data transformation
  • estimating missings
  • adjust extreme values
  • create new variables
  • try box-cox transformation

analysis

  • significance tests are widely overused, esp. in medicine, biology and psychology.
  • Statistically significant effects not always interesting, esp. using big samples
  • non-significant not always the same as no difference, opposite of previous example
  • enforcement of significant levels, why five not four or one or whatever. This can lead to an publican bias.
  • Estimates are more important, because they communicate relationships
  • Often null hypothesis silly, e.g. water doesn’t affect growth of a plant
    • Better: Interesting resuls should be repeatable in general and under different conditions. (Nelder: significant sameness)

appropriate procedure

  • do more than just one type of analysis, e.g. parametric vs. non-parametric or robust
  • robust good methods better than optimal methods with lots of assumptions
  • don’t just use a method you’re familiar with just because you are familiar with it
  • think in different ways about the problem
  • be prepared to make ad hoc modifications
  • you cannot know everything
  • analysis is more than just fitting the model

philosophical

  • assumed model is often more important than frequentest vs. Bayesian

generally

  • learn your statistics software and a scientific programming language
  • learn using a library, google scholar, searching in general

statistical consulting

  • work with the people; statistics isn’t about numbers, it’s about people
  • understand the problem and the objective
  • ask lots of questions
  • be patient
  • bear in mind resource constraints
  • write in clear language

numeracy

  • be skeptical
  • understand numbers
  • learn estimating
  • check dimensions
  • My book recommendation: Innummeracy
  • check silly statistics: e.g. mean outside of range
  • avoid graph without title and labels
  • don’t use linear regression for non-linear data
  • check assumptions, e.g. mult. regression: more variables than observations
  • my first time working with real data saw how different the process was
  • => Real work isn’t like your statistics 101 course; data is messy, you don’t have an unlimited amount of time or money
  • courses let you think that you got the data, look for your perfect model and you’re done – rather it is 70% searching for data & thinking about pitfalls, 25% cleaning up data and understanding it and about 5% doing the actual analysis

The second half of the book is filled with awesome exercises. I’d recommend everybody working with statistical techniques or working with data checking them out. They are insightful, interesting and stimulating. Furthermore, Chatfield shows that you can reveal insights with simple techniques.
Problem Solving: A statistician’s guide is a clear recommendation for everybody working with data on a daily basis, especially people with less than 2 to 5 years experience. I close with a quote of D. J. Finney: Don’t analyze numbers, analyze data.